Tracking your website’s search performance doesn’t have to feel like guessing in the dark. Most businesses pour resources into SEO without knowing what’s actually moving the needle.
The difference between thriving online and getting buried on page five? Understanding which metrics matter and how to use them strategically.
Understanding SEO Analytics and Why It Matters
SEO analytics is your system for monitoring how well your website performs in search engines. Think of it as your diagnostic tool—revealing what’s working, what’s failing, and where your biggest opportunities hide.
At its core, it tracks three fundamental areas: how many people find you through search, where your pages rank for important keywords, and how other websites link to your content.
Here’s what makes this crucial: search algorithms change constantly. Your competitors optimize relentlessly. Without analytics, you’re flying blind while everyone else reads the instruments.
The real power comes from using data to make smarter decisions. When organic traffic drops, you spot it immediately and diagnose the cause. When certain content drives conversions, you double down. When technical issues emerge, you fix them before they cost you rankings.
Step 1: Focus on Metrics That Actually Matter
The biggest mistake? Tracking everything and understanding nothing. You need to identify the key performance indicators that align with your specific business goals.
Keyword Rankings: Your Visibility Baseline
Where you rank for target keywords determines how much traffic you can capture. Higher rankings typically mean more clicks, more visitors, and more revenue.
Google Search Console gives you free access to this data. Navigate to the Performance section and enable “Average position” to see where you rank for different search queries. The data shows your actual positions over time, letting you track improvements or declines.
For more sophisticated tracking, specialized tools like Semrush’s Position Tracking monitor specific keywords you’re targeting. This matters because you might rank for thousands of terms, but only a subset drives business results.
Local businesses need different tracking. If you serve a geographic area, your Google Maps rankings matter more than traditional organic results. Tools specifically designed for local rank tracking show your visibility in map packs and local search results.
Organic Traffic: The Bottom Line Number
This metric reveals how many visitors actually find your site through unpaid search results. It’s perhaps the most straightforward indicator of SEO success.
Google Analytics 4 breaks down your traffic sources, showing exactly how many people arrived from organic search versus paid ads, social media, or direct visits. Check the Engagement section under Pages and Screens to see both site-wide traffic and performance of individual pages.
Understanding competitor traffic levels provides context for your own performance. When you know industry benchmarks, you can set realistic goals and identify gaps in your strategy. Competitive analysis tools estimate rival traffic levels and reveal which keywords drive their visitors.
Conversion Rates: Where Traffic Becomes Revenue
Visitors mean nothing without action. Organic conversions measure how many search visitors complete desired actions—purchases, signups, demo requests, whatever matters for your business.
Setting up conversion tracking in GA4 requires defining specific events as “key events” (Google’s term for conversions). Once configured, the Traffic Acquisition report shows conversions broken down by source, including organic search.
This metric separates vanity numbers from real business impact. You might have amazing traffic but terrible conversions, indicating a disconnect between what people expect and what they find. Or you might have modest traffic with exceptional conversion rates, suggesting you’ve nailed search intent but need broader keyword targeting.
Backlink Profile: Your Authority Signal
Search engines treat backlinks as votes of confidence. When reputable sites link to your content, it signals that you’re trustworthy and worth ranking higher.
Google Search Console’s Links report shows which sites link to you and which pages earn the most backlinks. This free tool gives you the basics—who’s linking, which content attracts links, and how your backlink profile grows over time.
More sophisticated backlink analysis reveals the quality and health of your link profile. Not all backlinks help—some can actually hurt your rankings. Backlink analysis tools assess the toxicity of your links, identify potentially harmful connections, and track both gains and losses in your backlink count.
Technical Health: The Foundation Everything Rests On
Your content might be brilliant, but if search engines can’t properly access and index your pages, you won’t rank.
Site health encompasses several technical factors: how easily search engines can crawl your pages, whether your site loads quickly, if you’ve implemented proper security protocols, and whether your architecture makes sense.
Technical audits identify problems like broken links, duplicate content, missing meta tags, slow load times, mobile usability issues, and security vulnerabilities. These issues often hide beneath the surface, quietly sabotaging your rankings.
Regular technical audits catch problems early. A site audit tool crawls your website just like Google does, flagging errors that need attention and prioritizing fixes based on severity.
Step 2: Build a Dashboard That Tells the Story
Raw data overwhelms. A well-designed dashboard transforms numbers into insights by consolidating all your important metrics in one view.
Looker Studio offers customizable dashboards that pull data from multiple sources. You can combine Google Analytics, Search Console, and other platforms into unified reports.
For a simpler approach, many SEO platforms offer built-in project dashboards that connect tools and data sources automatically.
Set up your dashboard by creating a project for your website, then configure individual tools—position tracking for target keywords, Google Analytics and Search Console connections, and technical audit tools.
Once configured, your dashboard updates automatically with change indicators showing whether numbers increased or decreased. Time-based charts visualize trends, and you can hover over specific dates to see exact values.
The real value emerges when you regularly review this dashboard. Analyze what the data reveals, take notes on significant observations, and ask questions about unusual patterns.
Step 3: Turn Insights Into Action
Data without action is just trivia. The final step is reviewing findings and making strategic decisions based on what you discover.
This follows a four-part cycle: analyze the data to spot meaningful trends, ask questions about what you’re seeing, dig deeper to understand causes, and take specific actions to optimize performance.
Diagnosing Performance Issues
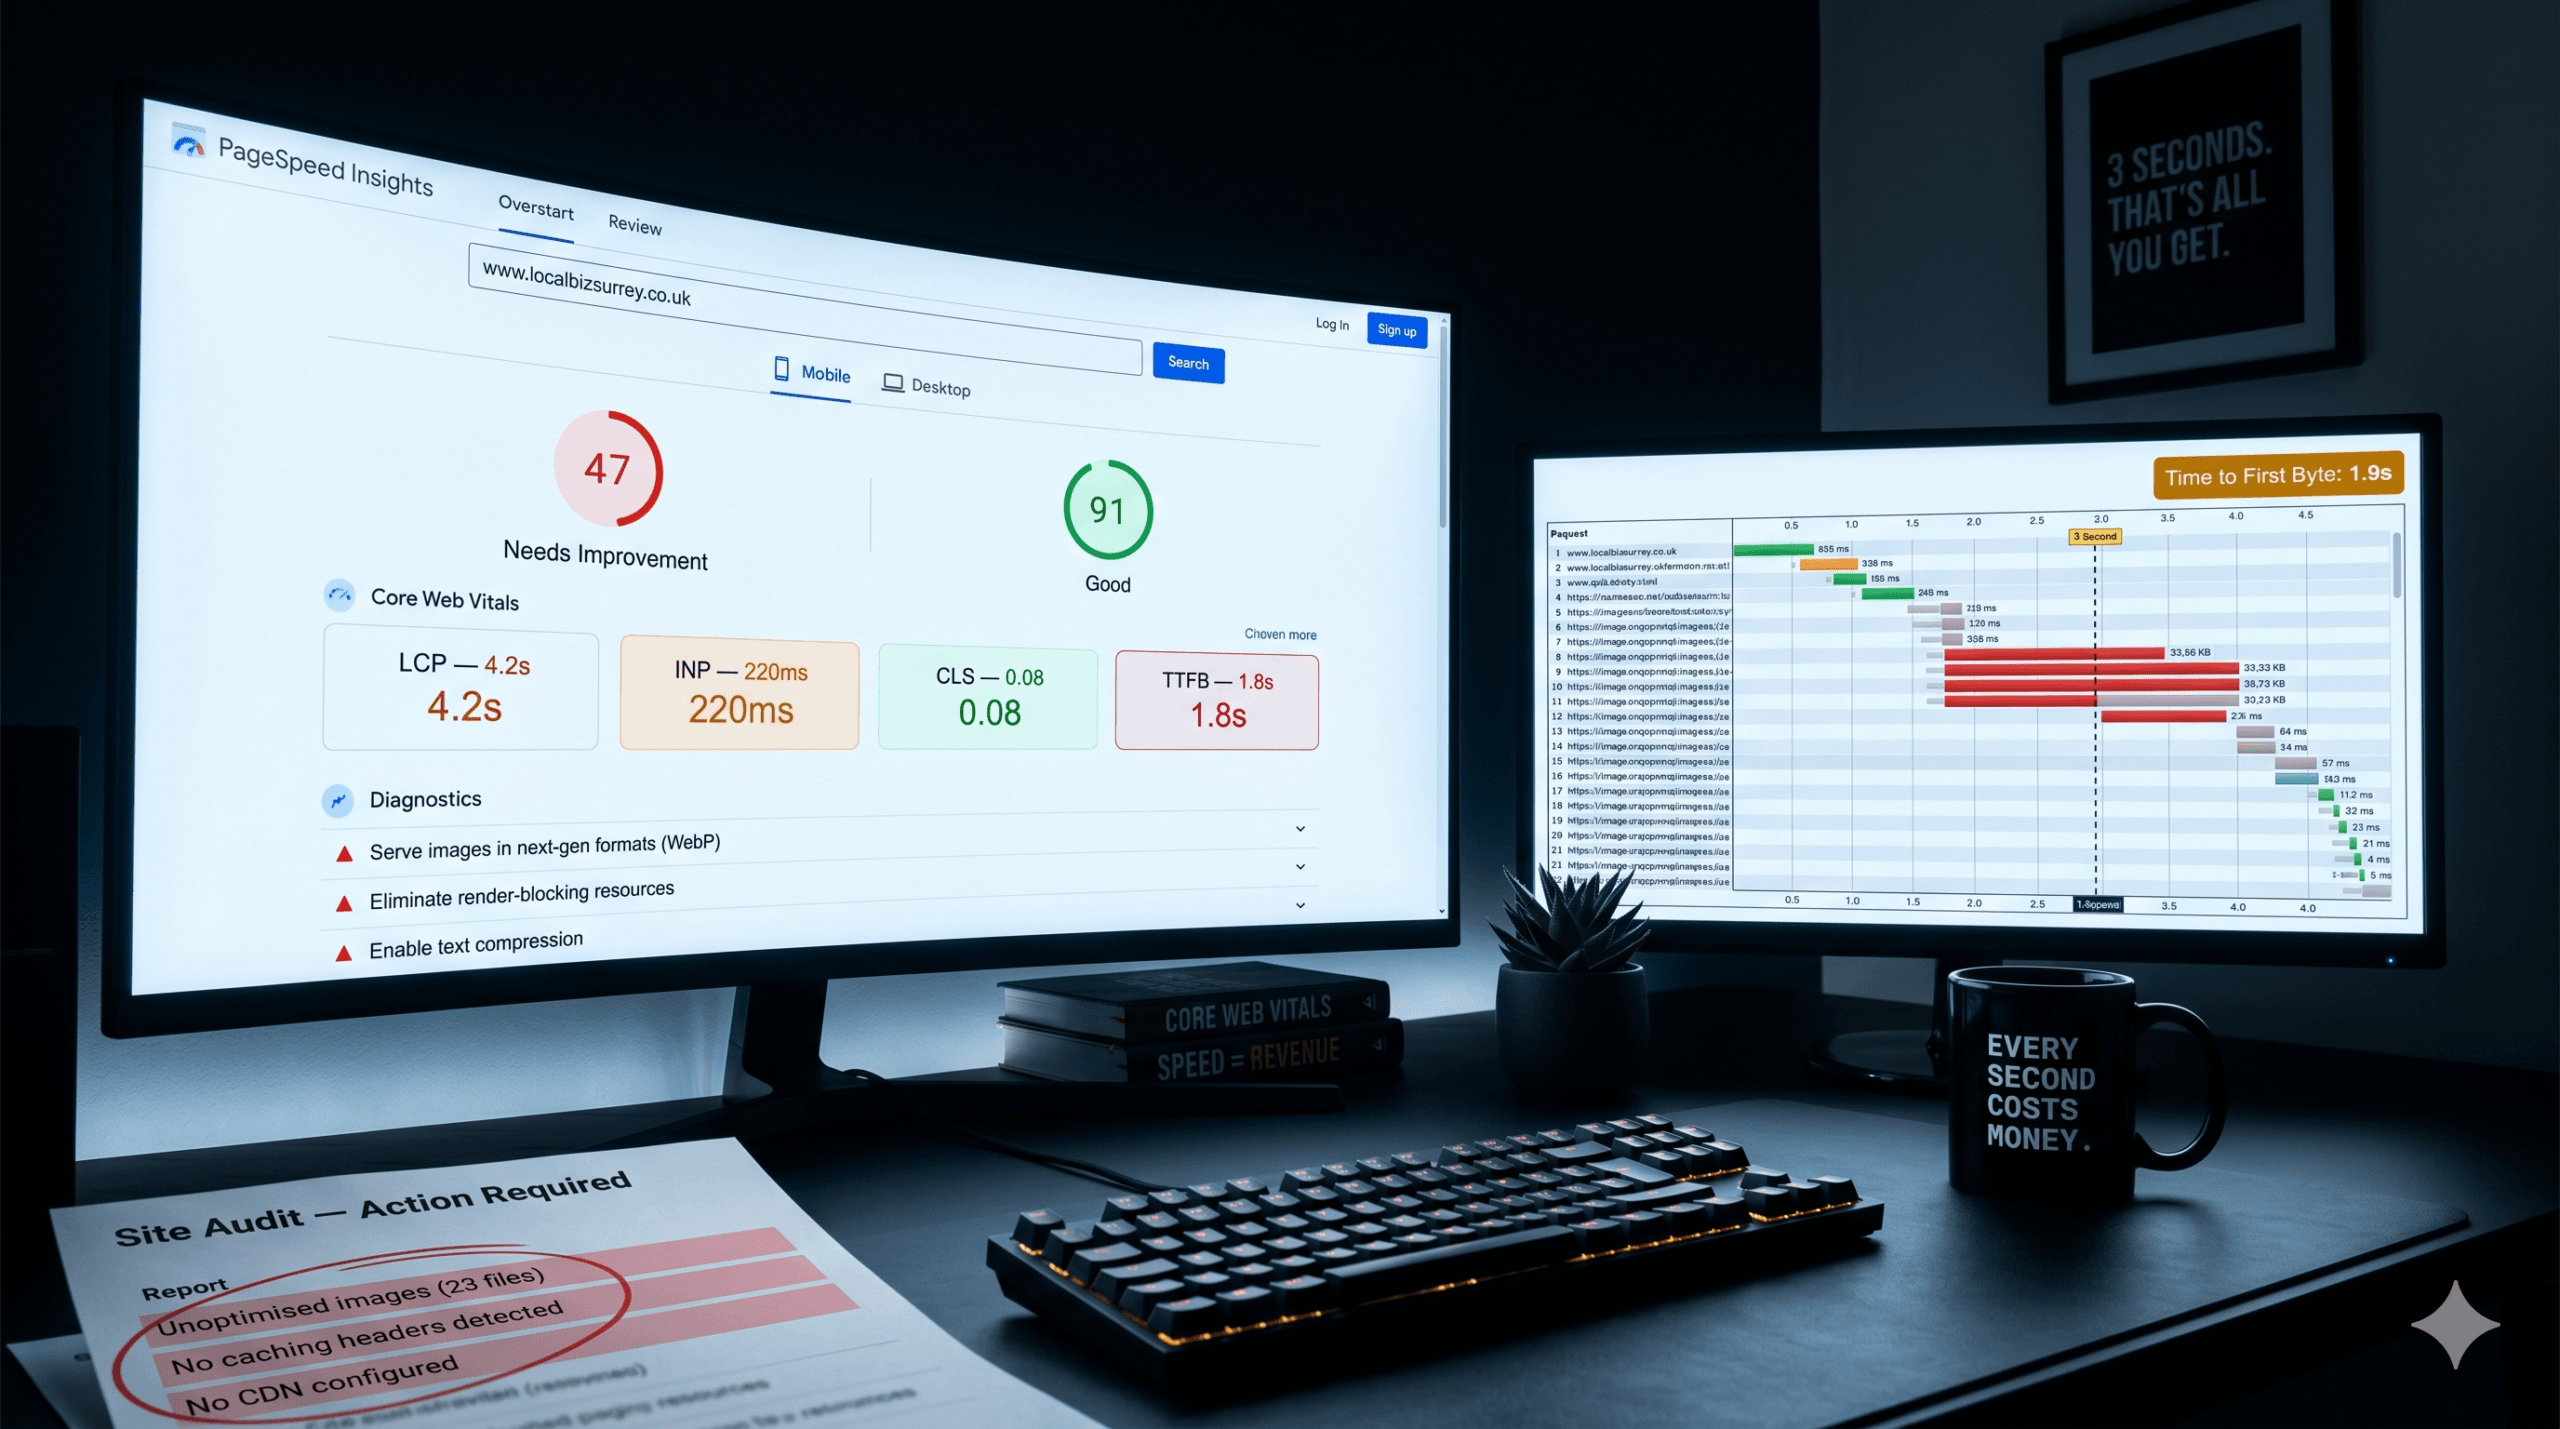
Let’s say your site performance score dropped compared to last month. The number itself doesn’t tell you much—you need to understand why.
Start by examining related metrics. Is your page load speed slower? In many cases, you’ll find that load speed actually improved, meaning something else caused the decline.
Look at specific issue reports. If you see a spike in unminified JavaScript and CSS files, you’ve likely found your culprit. These bloated files slow down your site’s responsiveness, hurting the overall performance score.
The solution? Minify your code to reduce file sizes. If you’re not technical, work with a developer to compress these files. Then monitor next month’s score to confirm the fix worked.
Recovering Lost Rankings
Maybe you notice keyword rankings dropped. Several of your target terms no longer rank in the top positions they once held.
Again, the number reveals a problem but not the cause. You need to investigate further.
Examine the pages that lost rankings. Check the content against current top-ranking competitors. You might discover your information is outdated while competitors cover the topic more comprehensively. Or perhaps search intent shifted, and your content no longer matches what people actually want.
Your action items might include updating pages with current data, expanding sections that answer common questions, adding new subsections that cover gaps, or restructuring content to better match search intent.
Track these pages closely after making changes. If traffic and rankings improve over subsequent weeks, you’ve identified and fixed the problem. If not, you may need additional adjustments.
Optimizing What’s Working
Don’t only focus on problems. Analytics also reveals unexpected successes.
Perhaps a blog post ranks higher than anticipated or drives more conversions than similar content. Dig into why. What keyword variations does it rank for? How does the content structure differ from other pages? What makes it particularly valuable to visitors?
Once you understand what’s working, replicate those elements across other content. If detailed examples resonate with your audience, add more throughout your site. If certain keyword patterns drive qualified traffic, incorporate them into future content planning.
Essential Tools for Effective SEO Analytics
You don’t need a massive tech stack, but certain tools make the process dramatically easier.
Google Analytics 4 tracks traffic patterns, user behavior, and conversions. It’s free and integrates seamlessly with other Google tools.
Google Search Console shows how Google sees your site—what you rank for, impressions, technical issues, and backlinks.
For advanced needs, comprehensive SEO platforms offer competitor analysis, automated rank tracking, backlink monitoring, and integrated reporting. The specific tools matter less than consistently using them.
Moving Forward With SEO Analytics
Search success requires more than creating good content and hoping for the best. It demands systematic monitoring, honest analysis, and data-driven optimization.
Start simple. Set up Google Analytics and Search Console if you haven’t already. Identify your three most important metrics. Check them weekly. Make one change based on the data, then measure whether it helped.
Over time, this practice becomes habitual. You’ll develop intuition for what normal looks like, making anomalies obvious. You’ll spot opportunities faster and waste less effort on tactics that don’t move your specific metrics.
The websites that dominate search results didn’t get there by accident. They got there by measuring what matters, learning from the data, and continuously improving based on what they discovered.